It's earnings season. This means, among many things, dividend increases. I track these for my own investing purposes, and I've noticed a trend over the past week: overwhelming dividend increases within the financials. I have noticed this trend among the regional banks especially. Many of these companies were hit hard in the 2008 crisis and ensuing "great recession". However, due to their small size and the maneuverability and flexibility that this enables them to have, many of the regional banks have begun to bounce back and are in healthy positions to begin building back their dividends (this is especially apparent in the 2012 EPS growth rates of the companies discussed below).
These regionally based banks have the assets and lending power to give their clients the "big bank" experience; however, they also have a localized focus due to their regional approach that lends itself to unparalleled customer service. With sector confidence rising and stock prices stabilizing in the industry, for investors in search of dividend growth, regional banks are worth looking into.
Wells Fargo (WFC)
Wells Fargo and Co. is a bank holding company which operates in three segments: Community Banking, Wholesale Banking, Wealth, Brokerage, and Retirement. WFC has become one of the, if not the best, run banks in the world. As of December 31, 2012, WFC had the highest market value of any of the US financial service companies, ranking third in the world. Wells Fargo, while a large entity, is focused on providing services and solutions to its local communities. WFC is the number 1 retail mortgage lender, mortgage servicer, used auto lender, small business lender, bond administrator for Commercial MBS, crop insurance provider, and total commercial real estate originator in the United States. The company holds $1.4 trillion in assets, manages more than 9,000 stores, and operates more than 12,000 ATM machines. Wells Fargo maintains 70 million customers and more than 265,000 team members.
WFC provides investors with a 20 year average dividend growth rate of 17.5% (the company did cut its dividend in 2009 and 2010, but has since increased its dividend 140% in 2011 and 83% in 2012). Over the same period of time, Wells has given shareholders a 10.8% annualized shareholder rate of return. The company has increased its quarterly dividend twice already in 2013, most recently a 20% increase from $0.25/share to $0.30/share. WFC goes ex-dividend on May 8.
(click to enlarge)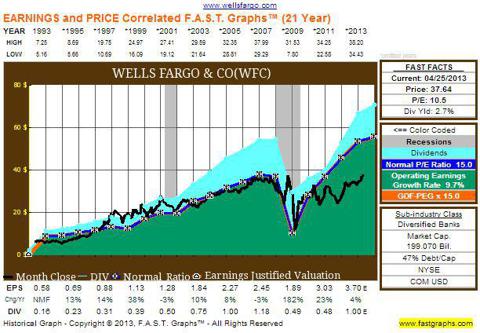
WFC fundamentals:
- Current Yield: 2.69%
- P/E multiple: 10.5x
- P/S: 2.3x
- P/Tangible Book: 1.6x
- Operating Margin: 34.38%
- Net Profit Margin: 23.65%
- ttm payout ratio: 25.4
- ROE: 13.45%
- Sales (5 year average): 6.59%
- 5 year EPS growth rate: 7.15%
- 1 year EPS: 19.16%
(click to enlarge)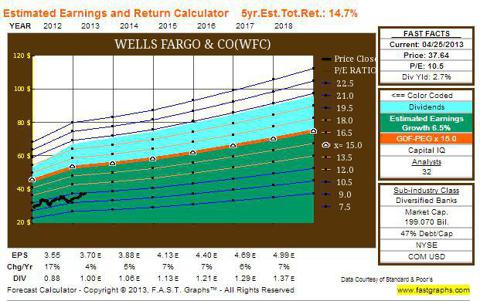
Because he is an idol of mine, I will mention that Wells Fargo is currently Warren Buffett's largest holding with Berkshire Hathaway.
Bar Harbor Bankshares (BHB)
Bar Harbor Bankshares (BHB) is a bank holding company with one wholly owned operating subsidiary: Bar Harbor Bank and Trust. BHB was founded in 1887 and now manages 15 branches across the state of Maine. This is a more traditional company in the sense of local banking, and it takes pride in the value that it brings to the communities that it serves. BHB is coming off of a record 2012 in regards to its earnings and EPS (up 12.9% and 11.6% YoY respectively). Bar Harbor Bankshares manages $1.3 billion in total assets which were also up 11.6% in 2012. BHB exceeds the "well capitalized" requirements with its leverage (8.85%), risk based capital (14.14%), and total risk-based capital (15.77%).
In 2012, BHB increased its cash dividends by 6.9% while lowering its payout ratio from 38.3% to 36.6% compared to 2011. The company kept this 7% increase trend up in Q1 2013, increasing its dividend to $0.305/share. BHB offers investors an 18 year average dividend growth rate of 6.9%. The company hasn't cut its dividend since 1999, which is as far back as my data goes. It did however not raise its dividend in 2010, paying out the same annual cash that it did in 2009. BHB provided an 8.9% annualized shareholder return over this same 20 year period. Like First Financial Bankshares (FFIN) (discussed below), BHB performed noticeably well during the "great recession", maintaining a healthy upward trend in stock price. BHB goes ex-dividend on May 13.
(click to enlarge)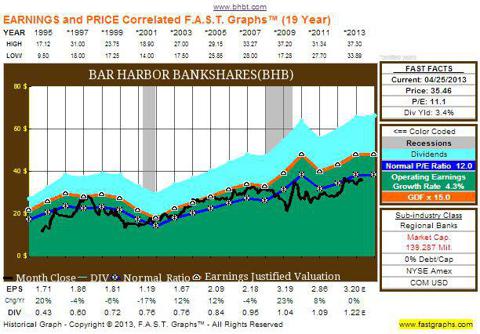
BHB fundamentals:
- current yield: 3.42%
- P/E multiple: 11.2x
- P/S: 3.1x
- P/Tangible Book: 1.1x
- P/Cash Flow: 10.2x
- Operating Margin: 38.97%
- Net Profit Margin: 27.90%
- ttm payout ratio: 36.6
- ROE: 10.12%
- Sales 5 year growth rate: -0.38%
- 5 year EPS growth rate: 6.71%
- 1 year EPS growth rate: 11.70%
(click to enlarge)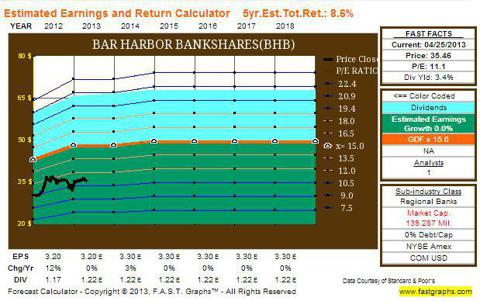
SunTrust Banks (STI):
SunTrust Banks, Inc. is a commercial banking organization that offers services to clients through its three operating segments: consumer banking and private wealth management, wholesale banking, and mortgage banking. STI's total assets amounted to $173.4 billion on December 31, 2012. SunTrust operates primarily in the southeastern portion of the United States where the company manages more than 1,600 retail branches and 2,900 ATMs. STI has focused on efficiency as of late. Due to lower expenses (Q1 noninterest expense decreased 12% YoY) and higher credit quality the company was able to post $0.63 EPS in Q1 2013 (opposed to $0.46 EPS in Q1 2012).
SunTrust has offered investors a 4.5% average annualized shareholder return over the past 20 years. This figure lags the S&P 500's annualized return of 7.7% over the same period. STI was hit hard by the financial collapse in 2008. The company's share price fell significantly, and the dividend was cut in three consecutive years spanning from 2008-2010: -2%, -92%, and -82%. SunTrust's annual dividend payout decreased from $2.92 to $0.04. During the past two years, the company has decided to increase its dividend, 200% ($0.04 to $0.12) in 2011 and 67% ($0.12 to $0.20) in 2012. The company has recently announced that it would double its current quarterly payout from $0.05 to $0.10. STI goes ex-dividend on May 29.
(click to enlarge)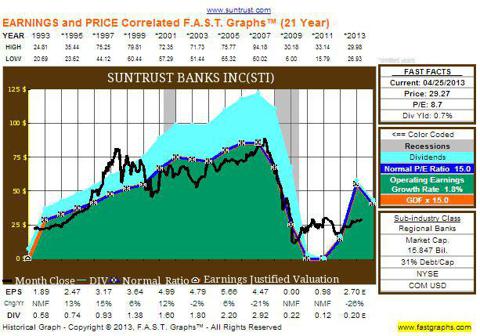
STI fundamentals:
- Current Yield: 1.41%
- P/E Multiple: 7.5x
- P/S: 1.5x
- P/Tangible Book: 1.1x
- P/Cash flow: N/A
- Operating Margin: 28.32%
- Net Profit Margin: 20.07%
- ttm payout ratio: 5.3%
- ROE: 10.08%
- Sales 5 year growth rate: -10.18
- 5 year EPS growth rate: -4.49%
- 1 year EPS growth rate: 282.53%
(click to enlarge)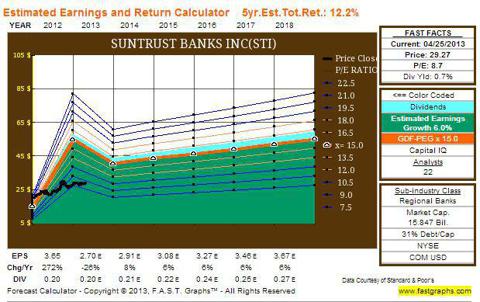
First Financial Bankshares:
First Financial Bankshares, Inc is a financial holding company which, through its subsidiaries, offers full service commercial banking throughout the state of Texas. FFIN manages 11 regional banks with 55 banking locations and a trust company with 6 locations. The company has $4.5 billion in assets (up 9.3% from 2011 totals). FFIN's new "One Bank, Eleven Regions" concept enables it to combine the best of what a "big bank" and a localized community bank can offer. First Financial Bankshares has produced higher earnings for 26 consecutive years. The company has been ranked either 1 or 2 in the top performing publicly traded bank ($1-$5 billion dollar category) by Bank Director for the past four years.
In 2012 FFIN's net income grew 8.6%, from $68.4 million in 2011 to $74.2 million. The company also experienced noticeable loan growth (16.9% YoY): $2.09 billion versus $1.79 billion in 2011. Total deposits were up 8.9% and year-end shareholder equity was up 9.5%. What's more, is that company's Financial Trust and Asset Management subsidiary might have outperformed the rest of the company's growth, posting 16.8% YoY book value of total assets in management and 14.2% company fee income. The company boasts a 48.14% efficiency ratio, a 4.28% net interest margin, and a return on average assets ratio of 1.75%.
Unlike some of the other banks discussed in this article, FFIN has shown steady growth in its recent past. The "great recession" did not affect this stock like it did many of the other financials. FFIN offers investors an 18 year average dividend growth rate of 11.2%. During this 18 year period, the company only decreased its annual dividend payout once (2007). Over the same period of time, First Financial has given shareholders a 12.5% annualized rate of return. FFIN recently announced a 4% increase in its quarterly dividend from $0.25/share to $0.26/share. FFIN goes ex-dividend on June 12.
(click to enlarge)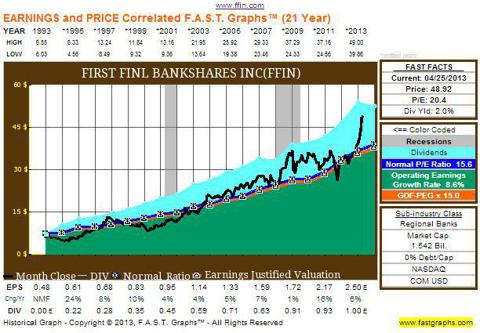
FFIN Fundamentals:
- Current Yield: 2.12%
- P/E Multiple: 20.6x
- P/S: 7.3x
- P/Tangible Book: 3.1x
- P/Cash flow : N/A
- Operating Margin: 47.11%
- Net Profit Margin: 35.24%
- ttm payout ratio: 41.6
- ROE: 13.88%
- Sales 5 year growth rate: -1.16
- 5 year EPS growth rate: 8.24%
- 1 year EPS growth rate: 8.43%
(click to enlarge)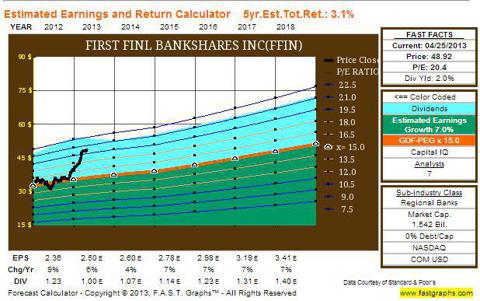
First Commonwealth Financial Corporation (FCF):
First Commonwealth Financial Corporation is a financial holding company which operates through its subsidiary, First Commonwealth Bank. Founded originally in 1934 before becoming a subsidiary of First Commonwealth in 1983, FCF currently manages approximately $6 billion in assets. The company's headquarters are located in Indiana, Pa and it operates banks in 15 Pennsylvania counties with a focus on western PA and Pittsburgh. FCF has 112 branch offices and over 50,000 ATMs, allowing it to serve over 300,000 clients. In 2012, First Commonwealth's net income increased drastically, from $15.3 million in 2011 to $42.0 million. FCF's return on average equity improved from 2.0% in 2011 to 5.5% in 2012. First Commonwealth's total assets increased by 154.3 million, and its loans increased 161.1 million (4%) in 2012.
FCF has offered investors a 4.1% annualized shareholder rate of return over the past 20 years. This figure is almost doubled by the S&P 500's annualized return of 7.7%. First Commonwealth has increased its dividend heftily in the past two years with increases of 100% in 2011 and 50% in 2012. The company recently announced a 20% dividend increase, bringing its quarterly payment up to $0.06/share. Investors should be aware that previous to the 2011 increase, FCF's dividend had been decreased in 2009 and 2010 (before that it had been stagnant at $0.68/share annually since 2006).
(click to enlarge)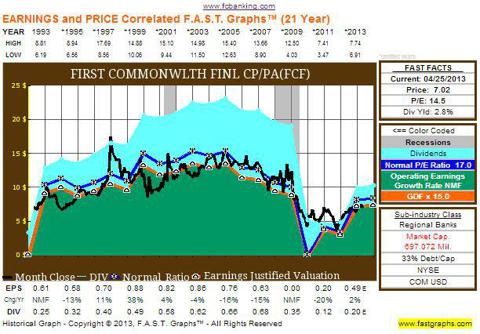
FCF fundamentals:
- Current Yield: 3.47%
- P/E Multiple: 17.2x
- P/S: 2.7x
- P/Tangible Book: 1.2x
- P/Cash flow : 13.4x
- Operating Margin: 22.26%
- Net Profit Margin: 16.49%
- ttm payout ratio: 44.7
- ROE:5.58%
- Sales 5 year growth rate: 7.93%
- 5 year EPS growth rate: -8.62%
- 1 year EPS growth rate: 176.84%
(click to enlarge)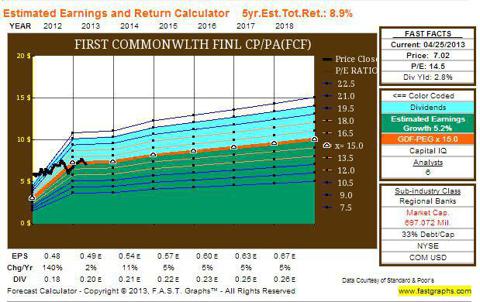
Webster Financial Corporation (WBS):
Webster Financial Corporation is a bank holding company and financial holding company whose principal asset is Webster Bank, National Association, which offers business and consumer banking, mortgage lending, financial planning, and trust and investment services to its clients throughout southern New England and Westchester County, New York. WBS has 167 banking offices and 293 ATMs. The company has recently announced a 4.7% Q1 YoY increase in EPS. The company also posted significant growth in its combined commercial and commercial real estate loans: 15.5%. To sum up WBS's Q1 report, James C. Smith, the company's chairman and CEO said:
Webster's first quarter results delivered a solid 16 percent increase in core pre-tax, pre-provision net earnings from a year ago. Core revenue grew and expenses dropped, creating positive operating leverage of six percent compared to a year ago. Loans grew by six percent from a year ago, led by another double-digit increase in the commercial portfolio as we continued to help lead the region's economic recovery. (quote taken from the company's first quarter earnings report)
Webster Financial offers investors a 7.3% average annualized shareholder return over the last 20 years. WBS has increased its annual dividend payout for 15 consecutive years before 2009, when the company cut its dividend 97%, from $1.20 to $0.04. In the last two years the company has increased its annual dividend drastically: 300% (from $0.04 to $0.16) and 119% ( from $0.16 to $0.35). WBS recently announced a 50% dividend increase from $0.10/share quarterly to $0.15/share quarterly. WBS does ex-dividend on May 2.
(click to enlarge)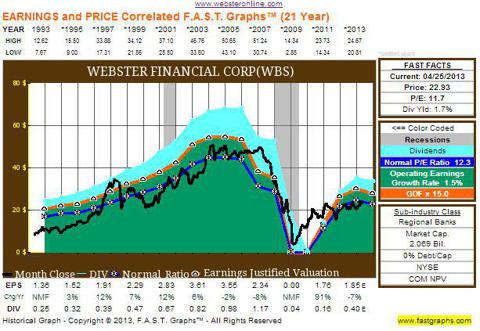
WBS fundamentals:
- Current Yield: 2.62
- P/E Multiple: 12.2x
- P/S: 2.7x
- P/Tangible Book: 1.3x
- P/Cash flow :N/A
- Operating Margin: 32.61
- Net Profit Margin: 22.72
- ttm payout ratio: 20.4
- ROE: 8.93%
- Sales 5 year growth rate: -6.98%
- 5 year EPS growth rate: -1.49%
- 1 year EPS growth rate: 17.34%
(click to enlarge)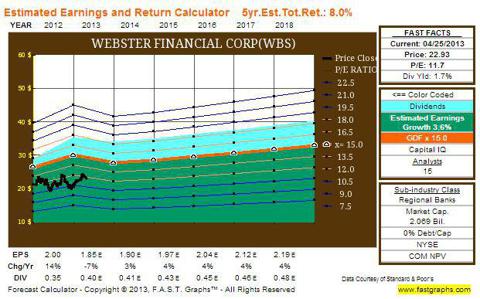
Cardinal Financial Corporation (CFNL):
Cardinal Financial Corporation is a financial holding company that owns Cardinal Bank which is a state-chartered community bank operating in Northern Virginia, Maryland, and Washington D.C. The company has 27 banking offices in the area. CFNL stock has experienced a run as of late (the stock offered investors a total shareholder return of 54% in 2012). The companies total assets increased 16.8% in 2012 to $3.04 billion. CFNL's loans also increased by double digits (10.5%) in 2012 to over $1.8 billion. Cardinal Financial's tangible common equity capital amounted to 9.4% of the company's total assets at the previous year's end. In 2012, the company also increased its net income by 61.8%, from $28 million is 2011 to $45.3 million. CFNL also posted record numbers in the ROA (1.7%) and ROE (16.02%) categories.
Since 2004, Cardinal Financial has provided investors with a 3.2% annualized shareholder rate or return. This more or less mirrors the S&P 500's 3.5% annualized rate of return over the same period of time. CFNL has shown great dividend growth in the recent past and no dividend decreases since its inception in 2004. In 2010, the company doubled its annual dividend payment from $0.04/share to $0.08/share. In 2011, Cardinal increased its divided by 50% and again in 2012 by 67%. The company has recently announced a 20% dividend increase to $0.06/share quarterly. CFNL goes ex-dividend on April 30.
(click to enlarge)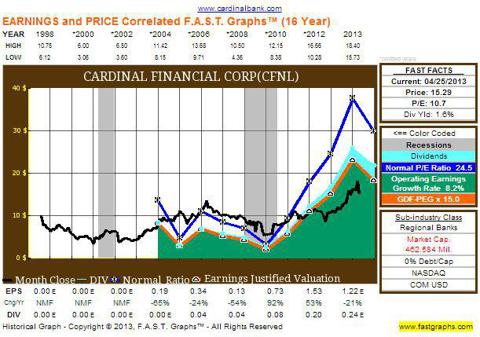
CFNL fundamentals:
- Current Yield: 1.6%
- P/E Multiple: 10.1x
- P/S: 2.9x
- P/Tangible Book: 1.5x
- P/Cash flow : 9.5x
- Operating Margin: 43.73%
- Net Profit Margin: 29.10%
- ttm payout ratio:15.3
- ROE: 15.48%
- Sales 5 year growth rate: 3.13%
- 5 year EPS growth rate: 53.16%
- 1 year EPS growth rate: 60.64%
(click to enlarge)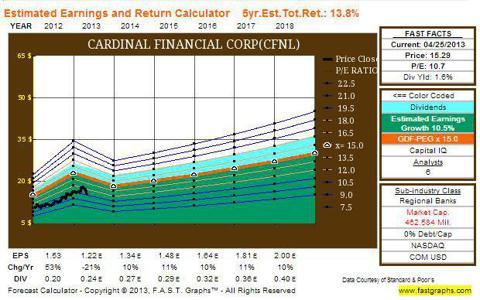
Susquehanna Bancshares (SUSQ):
Susquehanna Bancshares, Inc (SUSQ) is a financial holding company that operates through its subsidiaries in the mid-Atlantic region of the United States. The company manages more than 260 office locations in 40 counties and 4 states. Susquehanna now has a focus on the greater Philadelphia area where the company operates more than 60 branches with more than $3 billion in deposits. SUSQ had approximately $18 billion in total assets at year's end, 2012, making it the 35th largest commercial bank in the US.
Since 2008, the company has increased its capital ratios in all three tier 1 categories: leverage (8.97%), risk-weighted assets (11.37%), and total risk based capital (13.0%). SUSQ performed very well across the board in 2012. This performance is highlighted by a 93% in EPS from $0.40/share in 2011 to $0.77/share in 2012. The company's core revenue was up approximately 31% on the year. Net interest income was up 36% with core noninterest income having grown by 16%. As a part of this noninterest income, SUSQ hit an all-time high in regards to annual mortgage income in 2012. Susquehanna experienced net organic loan growth of $471 million (4.5%) in 2012. The company also managed to improve its net interest margin from 3.60% in 2011 to 4.01% in 2012.
Over the past 20 years, Susquehanna has provided investors with a 3.6% annualized rate of return. This is primarily due to the fact that the company lost over half of its market cap in the 2008 market crisis. As expected, during this crisis, SUSQ cut its dividend twice, -64% in 2009 and -89% in 2010. In 2008, the company was paying a $1.04/share annual dividend. In 2010, this figure was $0.04. Although, prior to the 2009 cut, the company had increased its dividend ever year since 1990 (this is as far back as my data goes). In 2011 and 2012, the company has increased its dividend 100% and 250% respectively. SUSQ recently announced a 14% quarterly dividend increase to $0.07/share. SUSQ went ex-dividend on April 26.
(click to enlarge)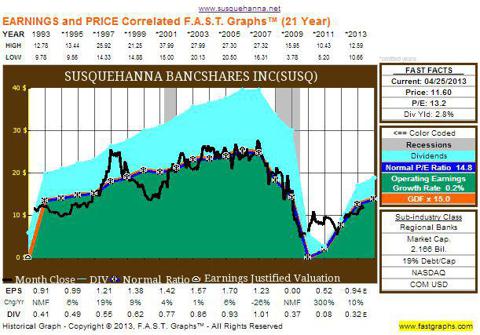
SUSQ fundamentals:
- Current Yield: 2.76
- P/E Multiple: 15.2x
- P/S: 2.9x
- P/Tangible Book: 1.7x
- P/Cash flow : 10.5x
- Operating Margin: 26.91%
- Net Profit Margin: 18.62%
- ttm payout ratio: 36.4
- ROE: 5.90%
- Sales 5 year growth rate: 6.20%
- 5 year EPS growth rate: -8.90%
- 1 year EPS growth rate: 91.71%
(click to enlarge)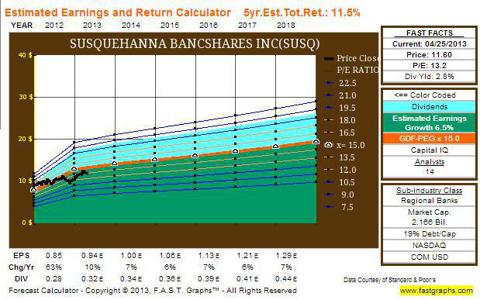
All research for this article was performed using the above companies' Q1 earnings reports, 2012 annual shareholder reports, dividend history tabs on their investor relations webpages, and F.A.S.T. Graphs.
Disclosure: I am long WFC. I wrote this article myself, and it expresses my own opinions. I am not receiving compensation for it (other than from Seeking Alpha). I have no business relationship with any company whose stock is mentioned in this article.
jillian michaels Freddy E NHL lockout Honey Boo Boo pirate bay Psalms 91 once upon a time
No comments:
Post a Comment
Note: Only a member of this blog may post a comment.